Installing a caching plugin is not a performance strategy. It is a band-aid on a system that was never configured to be fast. Yet most WordPress performance guides stop there - install W3 Total Cache, tick a few boxes, done. Then developers wonder why their GTmetrix score is still a C and their Largest Contentful Paint is sitting at 3.8 seconds.
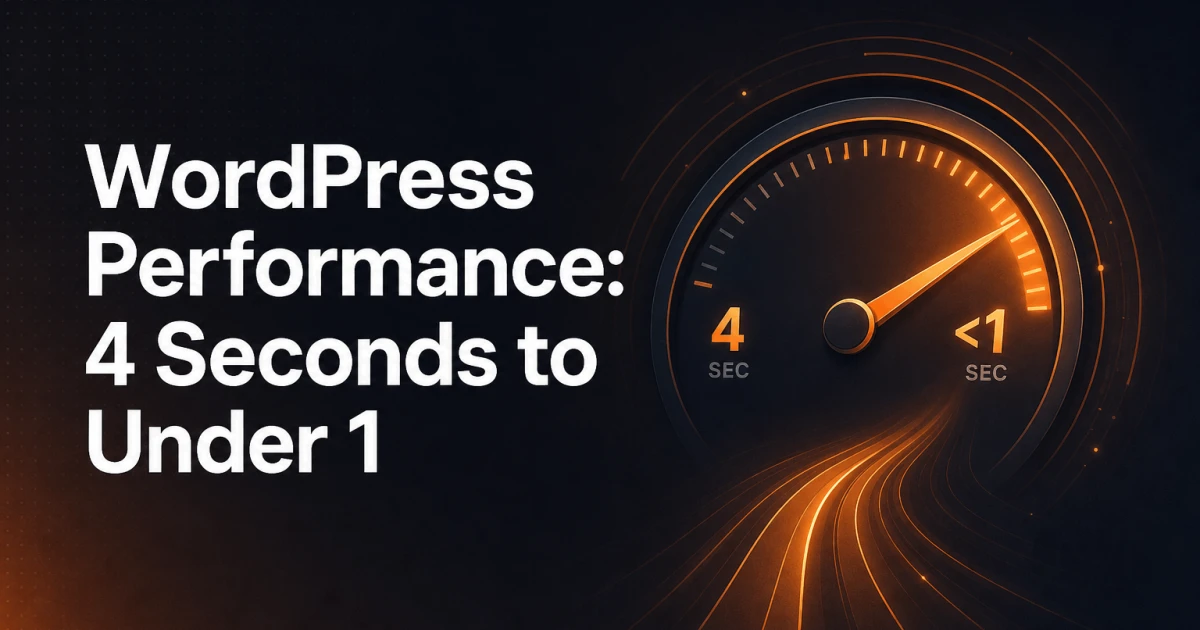
Getting a WordPress site from 4 seconds to under 1 second is not magic, and it does not require a complete rebuild. It requires working through the right sequence, at the right layer, without skipping the parts that feel unglamorous. This guide covers that sequence in full.
Why WordPress Sites Are Slow by Default
WordPress does not ship slow - it ships neutral. What makes most production WordPress sites slow is the accumulation of decisions made without performance in mind.
Themes are the first culprit. Page builder themes like Divi or Avada load dozens of CSS files, multiple JavaScript bundles, and icon font libraries on every page regardless of whether the page uses those features. A theme that looks impressive in a demo can add 800KB to 1.5MB of unoptimized assets to every request.
Plugins compound the problem. Each plugin that enqueues its own scripts and styles - regardless of page context - adds HTTP requests, render-blocking resources, and database queries. A site with 30 active plugins is not uncommon, and each one can add 1-5 database queries per page load. At 40 queries per page load, you are adding 200-400ms before a single byte of HTML reaches the browser.
Hosting is where most site owners under-invest. Shared hosting with a cold PHP process, no opcode cache, and a server located on a different continent from your users will produce TTFB (Time to First Byte) values of 800ms to 2 seconds on their own. No caching plugin fixes that.
The Optimization Sequence That Actually Works
Performance work done out of order produces diminishing returns. Optimizing images before fixing your TTFB is like repainting a car with a broken engine. The correct sequence moves from infrastructure inward: server first, then database, then assets, then delivery.
Server Layer: Fix the Foundation
Your target TTFB for a cached response is under 200ms. For an uncached dynamic response, under 500ms is acceptable. If you are seeing TTFB above 800ms on a cached page, no amount of asset optimization will get you to sub-1 second total load time.
Start with PHP version. PHP 8.1 and 8.2 are significantly faster than PHP 7.4 - benchmarks consistently show 15-25% throughput improvements on typical WordPress workloads. If your host is still offering PHP 7.x as the default, that alone is worth switching hosts over.
Enable OPcache if it is not already active. OPcache stores precompiled PHP bytecode in memory, eliminating the need to parse and compile PHP files on every request. On a busy WordPress site, this alone can reduce server response time by 30-50%. Check phpinfo() to confirm it is enabled and that opcache.memory_consumption is set to at least 128MB.
Server-side page caching - whether through a plugin like LiteSpeed Cache (if your host supports LiteSpeed), Redis object caching, or a reverse proxy like Nginx FastCGI cache - is the single highest-impact change available at this layer. A fully cached page served from memory can have a TTFB of 20-50ms. That is the ceiling you are working toward.
Consider hosting geography. If your audience is in Germany and your server is in Virginia, you are adding 80-120ms of network latency before any other factor. This is where a CDN with edge caching becomes structural, not optional - but more on that in the delivery section.
Database Layer: Stop the Query Accumulation
WordPress databases grow messy over time. Post revisions accumulate - a single post edited 40 times creates 39 revision rows. Transients expire but are never cleaned. Plugin tables orphan data after deactivation. A database with 500,000 rows in wp_options due to autoloaded transients can add 100-300ms to every page load.
Three specific actions deliver measurable results:
Limit post revisions. Add
define('WP_POST_REVISIONS', 5);towp-config.phpto cap revisions at 5 per post. Then run a one-time cleanup to delete existing excess revisions. This can reducewp_poststable size by 60-80% on editorial-heavy sites.Clean expired transients. Transients that have passed their expiration date remain in
wp_optionsuntil something explicitly deletes them. A plugin like WP-Optimize or a direct SQL query (DELETE FROM wp_options WHERE option_name LIKE '_transient_timeout_%' AND option_value < UNIX_TIMESTAMP();) handles this. On neglected databases, this single step removes tens of thousands of rows.Audit autoloaded options. Run
SELECT option_name, length(option_value) as size FROM wp_options WHERE autoload='yes' ORDER BY size DESC LIMIT 20;to identify large autoloaded options. Anything over 1MB autoloaded on every request is a problem worth investigating. Plugin data is the usual suspect.
For sites under heavy query load, adding a persistent object cache via Redis or Memcached prevents repeated identical database queries within a single page load. WordPress's built-in object cache is in-memory only and dies at the end of each request - Redis makes it persistent across requests.
Assets Layer: What Gets Loaded and How
Images are the heaviest assets on most WordPress pages and the easiest to fix. The modern standard is WebP with a JPEG fallback. WebP files are typically 25-35% smaller than equivalent JPEG files at the same visual quality. For a page with 10 images averaging 200KB each in JPEG, switching to WebP saves approximately 500-700KB per page load.
Use the <picture> element or a plugin that handles format negotiation automatically. If you need a quick conversion workflow without a plugin, a browser-based tool like the Image Converter or Image Compressor handles batch conversion without sending files to a third-party server. For hero images, aim for under 100KB. For thumbnails, under 20KB.
CSS and JavaScript need two treatments: minification and load order management. Minification removes whitespace and comments - typically reducing file size by 15-30%. More impactful is deferring non-critical JavaScript. Any script that does not affect the initial render should carry the defer or async attribute. Render-blocking scripts in <head> directly delay First Contentful Paint.
Web fonts deserve specific attention. Google Fonts loaded via a standard <link> tag add a DNS lookup, a connection, and a render-blocking stylesheet request. Self-hosting fonts eliminates the external DNS lookup and allows you to use font-display: swap to prevent invisible text during load. Subsetting fonts to only the character sets you actually use can reduce font file size from 150KB to under 20KB.
Also audit which plugins load assets on every page. A contact form plugin that loads its CSS and JS on blog posts is wasting resources. Use conditional loading - enqueue plugin assets only on pages where they are needed.
Delivery Layer: CDN, Browser Caching, and Lazy Loading
A CDN moves static assets - images, CSS, JS, fonts - to edge servers geographically close to your visitors. For a visitor in Tokyo hitting a server in Amsterdam, a CDN can reduce asset delivery latency by 150-300ms. Cloudflare's free tier, BunnyCDN, or KeyCDN all work well with WordPress and integrate with most caching plugins.
Browser caching tells returning visitors to reuse assets they already downloaded. Without proper Cache-Control headers, a visitor who loads your homepage and then clicks to a second page re-downloads every shared CSS and JS file. Set long cache lifetimes - 1 year (max-age=31536000) for versioned static assets, shorter for HTML. This is typically configured at the server level via .htaccess or Nginx config, not through WordPress itself.
Lazy loading defers the loading of images and iframes that are below the fold. Modern browsers support the native loading="lazy" attribute, which requires no JavaScript. Adding this attribute to all non-hero images on a page with heavy image content can reduce initial page weight by 40-60%. WordPress has added loading="lazy" to images by default since version 5.5, but verify your theme is not overriding this behavior.
For a deeper look at how CDN-level delivery intersects with SEO, the article on Edge SEO and CDN-based optimizations covers the technical overlap in detail.
Testing and Measuring: Use the Right Tools
Performance work without measurement is guesswork. Use multiple tools because they measure different things.
GTmetrix gives you a waterfall chart showing every request, its size, and its timing. Use it to identify which resources are largest, which are render-blocking, and where the longest waits occur. Test from a server location close to your actual audience.
WebPageTest is more granular. It shows connection times, SSL negotiation, TTFB per request, and supports testing from multiple locations and connection speeds. The filmstrip view shows exactly when your page becomes visually usable - critical for understanding LCP.
Lighthouse (built into Chrome DevTools) audits lab performance and gives specific, actionable recommendations tied to Core Web Vitals metrics. Run it in an incognito window to avoid extension interference.
Google Search Console Core Web Vitals report shows field data - real user measurements from Chrome users visiting your site. Lab tools and field data will differ; field data reflects actual user experience and is what Google uses for ranking signals.
Your target thresholds: LCP under 2.5 seconds, FID (or INP) under 200ms, CLS under 0.1. For a sub-1 second total load time in lab conditions, you need TTFB under 200ms, LCP under 700ms, and total page weight under 500KB for a typical content page. For a deeper breakdown of these metrics, the Core Web Vitals guide covers each signal and its measurement methodology.
If you want a comprehensive technical audit that surfaces performance issues alongside SEO problems in one pass, the SEO Analyzer covers page speed signals, image issues, and technical health in a single report - useful as a starting diagnostic before you begin the optimization sequence.
The 4-Second to Sub-1 Second Reality
A 4-second load time on a typical WordPress site usually breaks down like this: 900ms TTFB on shared hosting, 600ms for render-blocking CSS and JS, 1.2 seconds for unoptimized images loading in sequence, 400ms for external font requests, and 900ms of miscellaneous plugin overhead. None of these numbers are extraordinary - they are the default outcome of a WordPress site assembled without performance as a constraint.
Working through the sequence described above in a single focused session - upgrading PHP, enabling OPcache, cleaning the database, converting images to WebP, deferring non-critical JS, self-hosting fonts, and enabling a CDN - routinely produces results in the 800ms to 1.1 second range on sites that were previously at 3.5 to 5 seconds. The arithmetic is not complicated: each layer removes a specific block of latency, and the savings compound.
The sites that stay slow are the ones whose owners treat performance as a one-time plugin install rather than a layered system that needs to be understood. Understanding the system - and working through it methodically - is the difference between a GTmetrix A and a GTmetrix C that never improves no matter how many plugins you add.