You are probably spending more time optimising your Google Ads bid strategy than you are thinking about what happens the moment someone clicks your ad. That is a costly imbalance. A meticulously tuned campaign can drive thousands of clicks per day, and a slow-loading page will quietly absorb that spend, return nothing, and leave no obvious trace in your attribution dashboard. The problem does not show up as "slow site" in your reports - it shows up as a conversion rate that never quite reaches its potential.
Core Web Vitals are Google's framework for measuring exactly this problem. But most site owners treat them as an SEO checkbox rather than a revenue lever. This article makes the business case for treating them as the latter.
The Data Is Not Ambiguous
Google's own research found that as page load time increases from one second to three seconds, the probability of a mobile visitor bouncing increases by 32%. Push that to five seconds and the bounce probability jumps 90%. These are not edge cases - they are the norm for average WordPress sites running unoptimised themes and plugin stacks.
Vodafone published a case study showing that a 31% improvement in Largest Contentful Paint led to an 8% uplift in sales. Akamai's research has consistently shown that a 100-millisecond delay in response time can reduce conversion rates by up to 7%. For a site doing £500,000 in annual revenue, that is £35,000 in lost conversions from a delay most users would not consciously notice.
The pattern holds across industries. WooCommerce stores, lead generation sites, SaaS landing pages - the relationship between perceived load speed and completed actions is consistent and measurable. The users who do not convert are not telling you why. They have already left.
What Core Web Vitals Actually Measure - In Business Terms
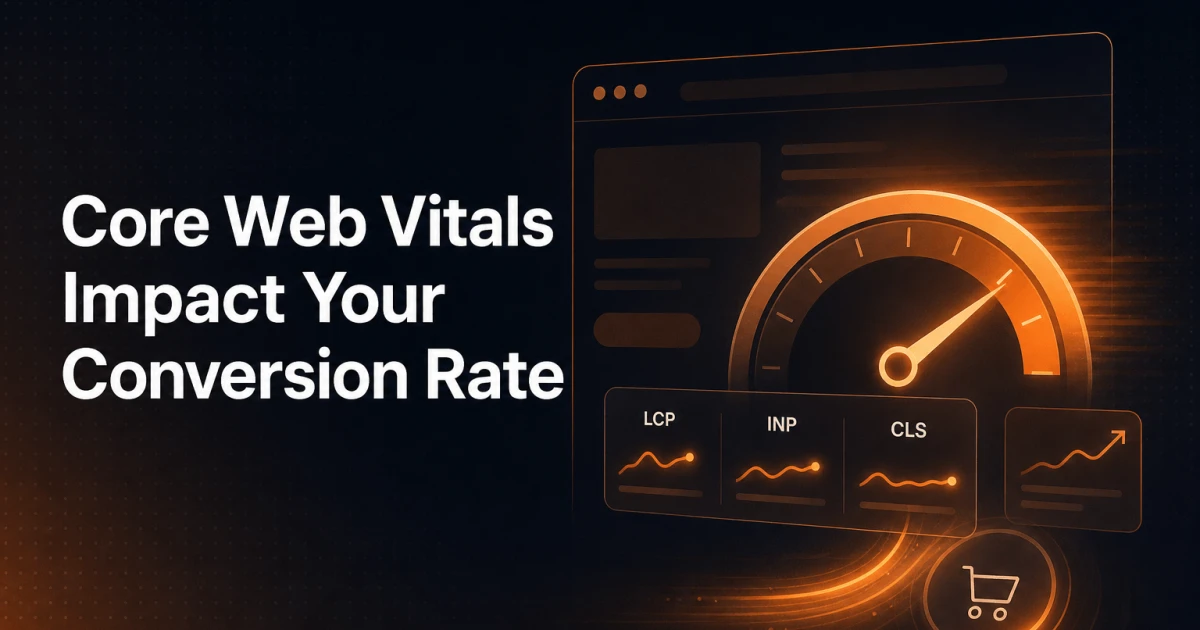
Google's Core Web Vitals framework currently focuses on three metrics. Each one maps directly to a specific moment in the user experience where trust is either established or lost.
LCP - Largest Contentful Paint
LCP measures how long it takes for the largest visible element on the page - usually a hero image, a headline, or a product photo - to fully render. Google's threshold for a "good" score is under 2.5 seconds. The business translation: LCP is the moment a visitor decides whether your page is working or broken. If that hero image is still loading at four seconds, the subconscious verdict is already in. The page feels unreliable, and an unreliable page sells nothing.
CLS - Cumulative Layout Shift
CLS measures how much the page visually jumps around as elements load. A score of 0.1 or below is considered good. The business translation: layout shift is the digital equivalent of pulling a chair out from under someone. A user moves to click "Add to Cart" and the button shifts down because an ad banner loaded late. They click the wrong element, feel frustrated, and leave. CLS does not just hurt conversions - it actively damages them at the moment of intent.
INP - Interaction to Next Paint
INP replaced First Input Delay in March 2024 and measures the full responsiveness of a page across all interactions during a visit - not just the first click. A good INP score is under 200 milliseconds. The business translation: INP is the metric that exposes whether your site feels alive. A sluggish response to a button click, a dropdown that hesitates, a form field that lags behind typing - these micro-delays accumulate into a perception of low quality. Users do not think "high INP score"; they think "this site feels cheap."
How Each Metric Maps to a Specific Conversion Failure
The reason most businesses miss this connection is that CWV failures rarely produce a single dramatic exit. They produce friction - and friction compounds.
Poor LCP kills top-of-funnel trust. A visitor arriving from a paid ad or organic search result has zero loyalty to your brand at that moment. A slow initial render tells them the experience is going to be poor before they have read a single word. The drop-off here is invisible in your funnel analytics because it happens before any meaningful engagement is recorded.
Poor CLS destroys micro-conversion moments. Newsletter signups, "Learn More" clicks, product image interactions - these are the small commitments that warm users toward a purchase. Layout shifts interrupt them at exactly the wrong moment, turning intent into irritation.
Poor INP erodes checkout completion. This is where the revenue impact is most direct. A form that responds slowly, a quantity selector that lags, a payment button that takes 400ms to acknowledge a tap - these are the final obstacles between a user and a completed transaction. INP failures at checkout are silent revenue leaks that no A/B test can compensate for.
WordPress-Specific CWV Killers and How to Fix Them
WordPress powers over 40% of the web, and it has a well-documented performance problem - not because the core is slow, but because the ecosystem around it is built for feature richness, not load efficiency. The most common CWV killers on WordPress sites are predictable and fixable.
Unoptimised Images
Images are the single largest contributor to poor LCP scores on WordPress. Most themes load full-resolution images with no lazy loading, no modern format (WebP or AVIF), and no explicit width/height attributes - the last of which directly causes CLS. The fix involves converting images to WebP, compressing without visible quality loss, and ensuring every image element has defined dimensions. Tools like the Signocore Image Compressor and Image Converter handle both compression and format conversion without requiring a subscription or uploading files to a third-party server.
Render-Blocking JavaScript and CSS
Every plugin you install has a chance of injecting scripts that block the browser from rendering the page. Page builders are particularly aggressive here - they load their entire asset library regardless of which components are actually used on a given page. Defer non-critical JavaScript, inline critical CSS for above-the-fold content, and audit which plugin scripts are loading on which page types.
No Caching Layer
A WordPress site hitting the database on every request will never achieve good LCP scores at scale. Caching - at the page level, object level, and ideally at the CDN edge - is non-negotiable for performance. Most managed WordPress hosts include some form of caching, but default configurations are rarely optimised for CWV.
Heavy Theme Frameworks and Page Builders
Themes built on heavyweight frameworks load hundreds of kilobytes of CSS and JavaScript regardless of what your page actually contains. This directly inflates LCP and INP. Switching to a leaner theme or a block-based approach with WordPress's native editor removes entire categories of performance debt without requiring any plugin configuration.
Third-Party Scripts
Chat widgets, marketing pixels, heatmap tools, and social embeds each add external requests that the browser must resolve before rendering can complete. Audit your third-party script load using the Network tab in Chrome DevTools. Every script that is not generating measurable revenue should be questioned. Load non-critical scripts asynchronously and consider using a script manager to defer them until after the page is interactive.
Monitoring CWV Over Time
Fixing CWV problems once is not enough. Performance degrades with every plugin update, theme change, and new piece of content. Monitoring needs to be continuous.
Google Search Console provides the Core Web Vitals report under the "Experience" section. This shows field data - real user measurements from Chrome browsers visiting your site - segmented by mobile and desktop. It is the authoritative source for understanding how your actual visitors experience your pages, not how a test tool simulates them.
PageSpeed Insights combines field data from the Chrome User Experience Report (CrUX) with lab data from a Lighthouse audit. Use it to diagnose specific pages and get prioritised recommendations. The URL-level analysis is particularly useful for identifying which page templates are causing the most damage.
For a broader technical SEO audit that surfaces CWV issues alongside on-page and structural problems, the Signocore SEO Analyzer provides a free in-depth audit covering performance signals, image issues, and technical SEO factors in a single report - useful for identifying the quick wins before diving into deeper optimisation work.
Set up a monthly review cadence at minimum. Track your LCP, CLS, and INP scores against Google's thresholds (LCP under 2.5s, CLS under 0.1, INP under 200ms) and log changes alongside any site modifications. This creates an accountability loop that most WordPress sites completely lack.
The Business Case for Investing in Performance
Performance optimisation has an ROI problem - not because the returns are poor, but because they are hard to attribute. Unlike a paid campaign, you cannot point to a line item that says "faster site - £40,000 additional revenue." The impact is distributed across every session, every micro-interaction, and every conversion that did not drop off.
The way to make the business case internally is to work backwards from your current conversion rate. If your site converts at 2% and you receive 50,000 monthly visits, you are generating 1,000 conversions. A 10% improvement in conversion rate - well within what serious performance work can deliver - produces 100 additional conversions per month. Apply your average order value or lead value to that number. Then compare it against the cost of the optimisation work. The payback period is almost always measured in weeks, not months.
Performance also compounds in a way that paid traffic does not. Faster pages rank better - Google has used page experience signals as a ranking factor since 2021. Better rankings drive more organic traffic. More organic traffic at a higher conversion rate means the revenue impact of a performance investment grows over time rather than stopping the moment you pause a campaign.
For WordPress sites, the Signocore SEO plugin addresses the technical SEO layer - schema, metadata, and indexability - that works alongside performance to determine how well a page ranks and how compelling it appears in search results. Performance and technical SEO are not separate workstreams; they are the same investment in site quality.
The businesses winning on organic search and paid conversion in 2025 are not the ones with the biggest budgets. They are the ones who stopped treating their site as a brochure and started treating it as infrastructure. Every millisecond of load time is a decision your visitors are making about whether to trust you. Make sure the answer is the one you want.